
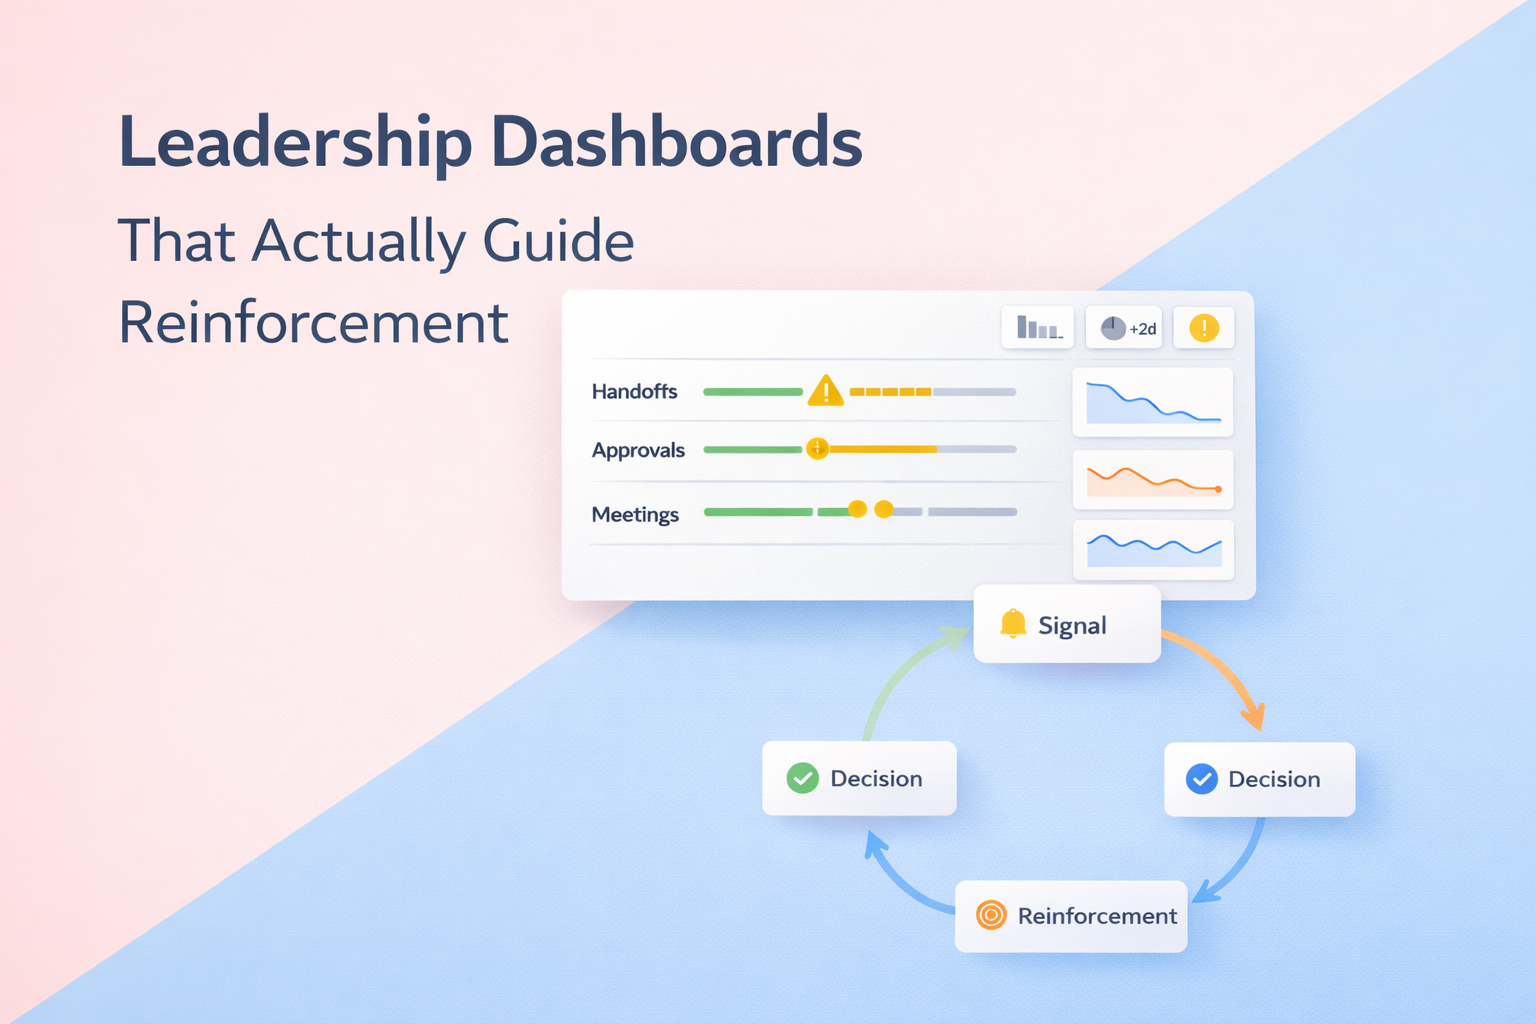

A leadership dashboard is useful when it helps someone make a decision. For a learning or change program, that means showing where people had an opportunity to apply a skill, where practice is breaking down and what support to change next.
Updated October 27, 2026.
This guide provides a minimum dashboard specification for a learning-adoption pilot. It can be built in a spreadsheet. The example is a design recommendation, not a screenshot of GWork or a claim that every field is available in the product.
Start with the decision, then choose the metric
Before adding a chart, finish this sentence: “If this signal changes, the program owner will investigate or change ___.” If nobody can name the decision, leave the metric out.
| Question | Measure | Decision it supports |
|---|---|---|
| Could people use the skill? | Relevant opportunities reported, with reporting coverage. | Change task allocation or practice access. |
| Did they try it? | Attempts divided by relevant opportunities. | Investigate friction, unclear expectations or a poorly timed cue. |
| Was the attempt useful? | Sample meeting an agreed quality standard, with sample size. | Provide demonstration, rehearsal or feedback. |
| Was support delivered? | Agreed manager reviews completed out of reviews due. | Adjust manager capacity and responsibilities. |
| Did a work result change? | A relevant operational measure alongside contextual changes. | Investigate impact without assuming causality. |
The fields each dashboard row needs
- Behavior: the action and situations in scope.
- Population and period: who and when the number describes.
- Numerator and denominator: retain counts alongside percentages.
- Source: self-report, observation or work artifact.
- Coverage: who supplied data and what is missing.
- Quality standard: what counted as an adequate attempt.
- Owner and next action: who will investigate, by when.
Do not combine incompatible definitions into a single adoption score. Completion of a prompt is not evidence that the underlying behavior happened.
Illustrative dashboard: coaching after a workshop
Invented numbers for explanation only. In week two, eight of ten managers submit a log. Their logs describe 40 appropriate coaching opportunities and 24 attempts to explore options before offering advice. Six of ten sampled attempts meet the agreed quality standard.
The dashboard should show application as 24/40 (60%), reporting coverage as 8/10 managers and quality as 6/10 sampled attempts. The two managers without logs are missing data, not confirmed non-users. The ten sampled attempts do not establish quality across all 24 attempts.
A useful decision is to investigate why appropriate opportunities were missed and rehearse the step that was weak in the sample. Increasing reminder volume without that investigation may solve the wrong problem.
Run a short weekly review
- Check definitions, coverage and collection problems before interpreting trends.
- Ask what changed in workload, staffing or opportunities.
- Choose one obstacle the team can remove.
- Assign an owner and a date to check whether the change helped.
- Record the decision beside the metric so the next review has context.
Set thresholds locally after observing a baseline. A red indicator should trigger inquiry, not an automatic judgment about an employee. Small samples and sensitive comments need restricted access and clear retention rules.
Keep adoption and business impact separate
A rise in practice alongside a better outcome is an association. Other changes may have contributed. Stronger evaluation may require comparable groups, longer follow-up or another design suited to the setting. The training-transfer measurement guide explains what can and cannot be concluded from common pilot data.
Build the first version
Choose one behavior, one opportunity definition and one quality check. Use the free action plan kit to define the practice before building the dashboard. For a development conversation, pair it with the employee development plan.
GWork helps organizations connect priorities with daily actions and follow-through. Discuss your pilot and reporting needs to establish what fits your workflow and what evidence you need.