 Skip to content

Organizational behavior is the most reliable signal of whether execution is holding or drifting. Most organizations claim to care about behavior. Very few measure it in a way leaders can actually use to govern execution.
After strategic decisions are made, attention shifts and execution begins to drift as reinforcement weakens. By the time outcomes fail, the damage is already done.
This article explains how leaders can measure organizational behavior as an execution signal, not an HR metric. It shows how executives can see where execution is drifting before results decline, which behaviors are stabilizing execution and which are degrading it, and what real proof of behavior change looks like at scale.
At the center of this discipline is a simple truth: behavior is not about attitude or motivation. Behavior is what happens after decisions are made. If leaders want execution reliability, they must see and govern signals, patterns, and proof. That is what measuring organizational behavior correctly is really about.
1. Rethinking “Measuring Organizational Behavior” from a Leadership Perspective
When most organizations talk about measuring behavior, they default to familiar tools: engagement surveys, culture assessments, sentiment dashboards, and training completion reports. These tools may describe how people feel. They do not tell leaders whether execution is holding.
The real leadership question is not “Are people engaged?” It is “Are the behaviors required to execute our decisions actually happening, consistently, inside real workflows?”
Outcomes Always Lag Behavior
Revenue misses, quality failures, customer churn, safety incidents, these are late signals. By the time outcomes move, behavior drift has already been happening for weeks or months. Leaders who rely only on outcome metrics are always reacting after execution has degraded. That is why measuring organizational behavior must focus on execution behavior itself, not attitudes, intent, or effort.
Behavior as an Execution Unit
Within Behaviour Analytics for Execution, behavior is not psychology. Behavior is defined as the concrete actions required to move a leadership decision forward, the follow-through steps that keep execution stable over time, and the reinforcement loops that prevent drift after attention fades. Understanding how execution governance works helps reframe behavior measurement as a governance discipline, not an HR activity.
2. What an Organizational Behavior Measurement System Really Is
A true organizational behavior measurement system does not live inside HR dashboards, engagement tools, or generic analytics platforms. It exists where execution actually happens. That means tracking organizational behavior after decisions are made, inside operational workflows, and where drift begins long before outcomes fail.
The objective is not surveillance and not individual evaluation. The objective is execution stability.
Post-Decision Follow-Through Is the Measurement Surface
The behaviors worth measuring typically appear after a strategic priority is announced, a new process is introduced, a risk is escalated, or a leadership directive is communicated. Did execution follow through, and did it remain stable over time?
Execution visibility platforms like GWork.io focus precisely on this layer: not watching people, but seeing whether execution loops stay intact once leadership attention moves on.
3. Signals: What Leaders Need to See Early
Signals are the earliest indicators of execution instability. In any organizational behavior measurement approach, signals do not prove failure on their own. They tell leaders where to look before drift becomes systemic. Common early signals include slow or hesitant starts after decisions, skipped or reordered steps, incomplete handoffs, delayed reinforcement, and repeated deferrals.
Cue Signals: Did Execution Even Start?
Cue signals show whether execution mechanisms are actually activated. A checklist assigned but never opened, a workflow triggered but stalled immediately, an alert fired but ignored. Cue failures signal that reinforcement or enablement must move earlier, not louder.
Action Signals: Is Execution Progressing as Designed?
Action signals reveal friction inside execution. Tasks completed out of sequence, critical steps repeatedly delayed, ownership bouncing between teams. Action friction tells leaders where execution conditions need redesign, not coaching. Knowing which behavioral triggers stabilize workflows helps leaders intervene at the right moment.
Completion Signals: Are Execution Loops Closing?
Many execution failures occur in the final stretch. Reports never submitted, follow-ups left open, risks identified but never resolved. Incomplete loops are prime breeding grounds for drift and indicate where accountability and closure mechanisms must be reinforced.
Reinforcement Signals: Is Execution Being Stabilized?
Reinforcement is what determines whether behavior holds. Key reinforcement signals include recognition delivered late or not at all, no consequence for skipped steps, and feedback loops not triggered. Missing reinforcement signals predict future execution decay, even when performance still looks stable.
4. Patterns: Where Leadership Meaning Emerges
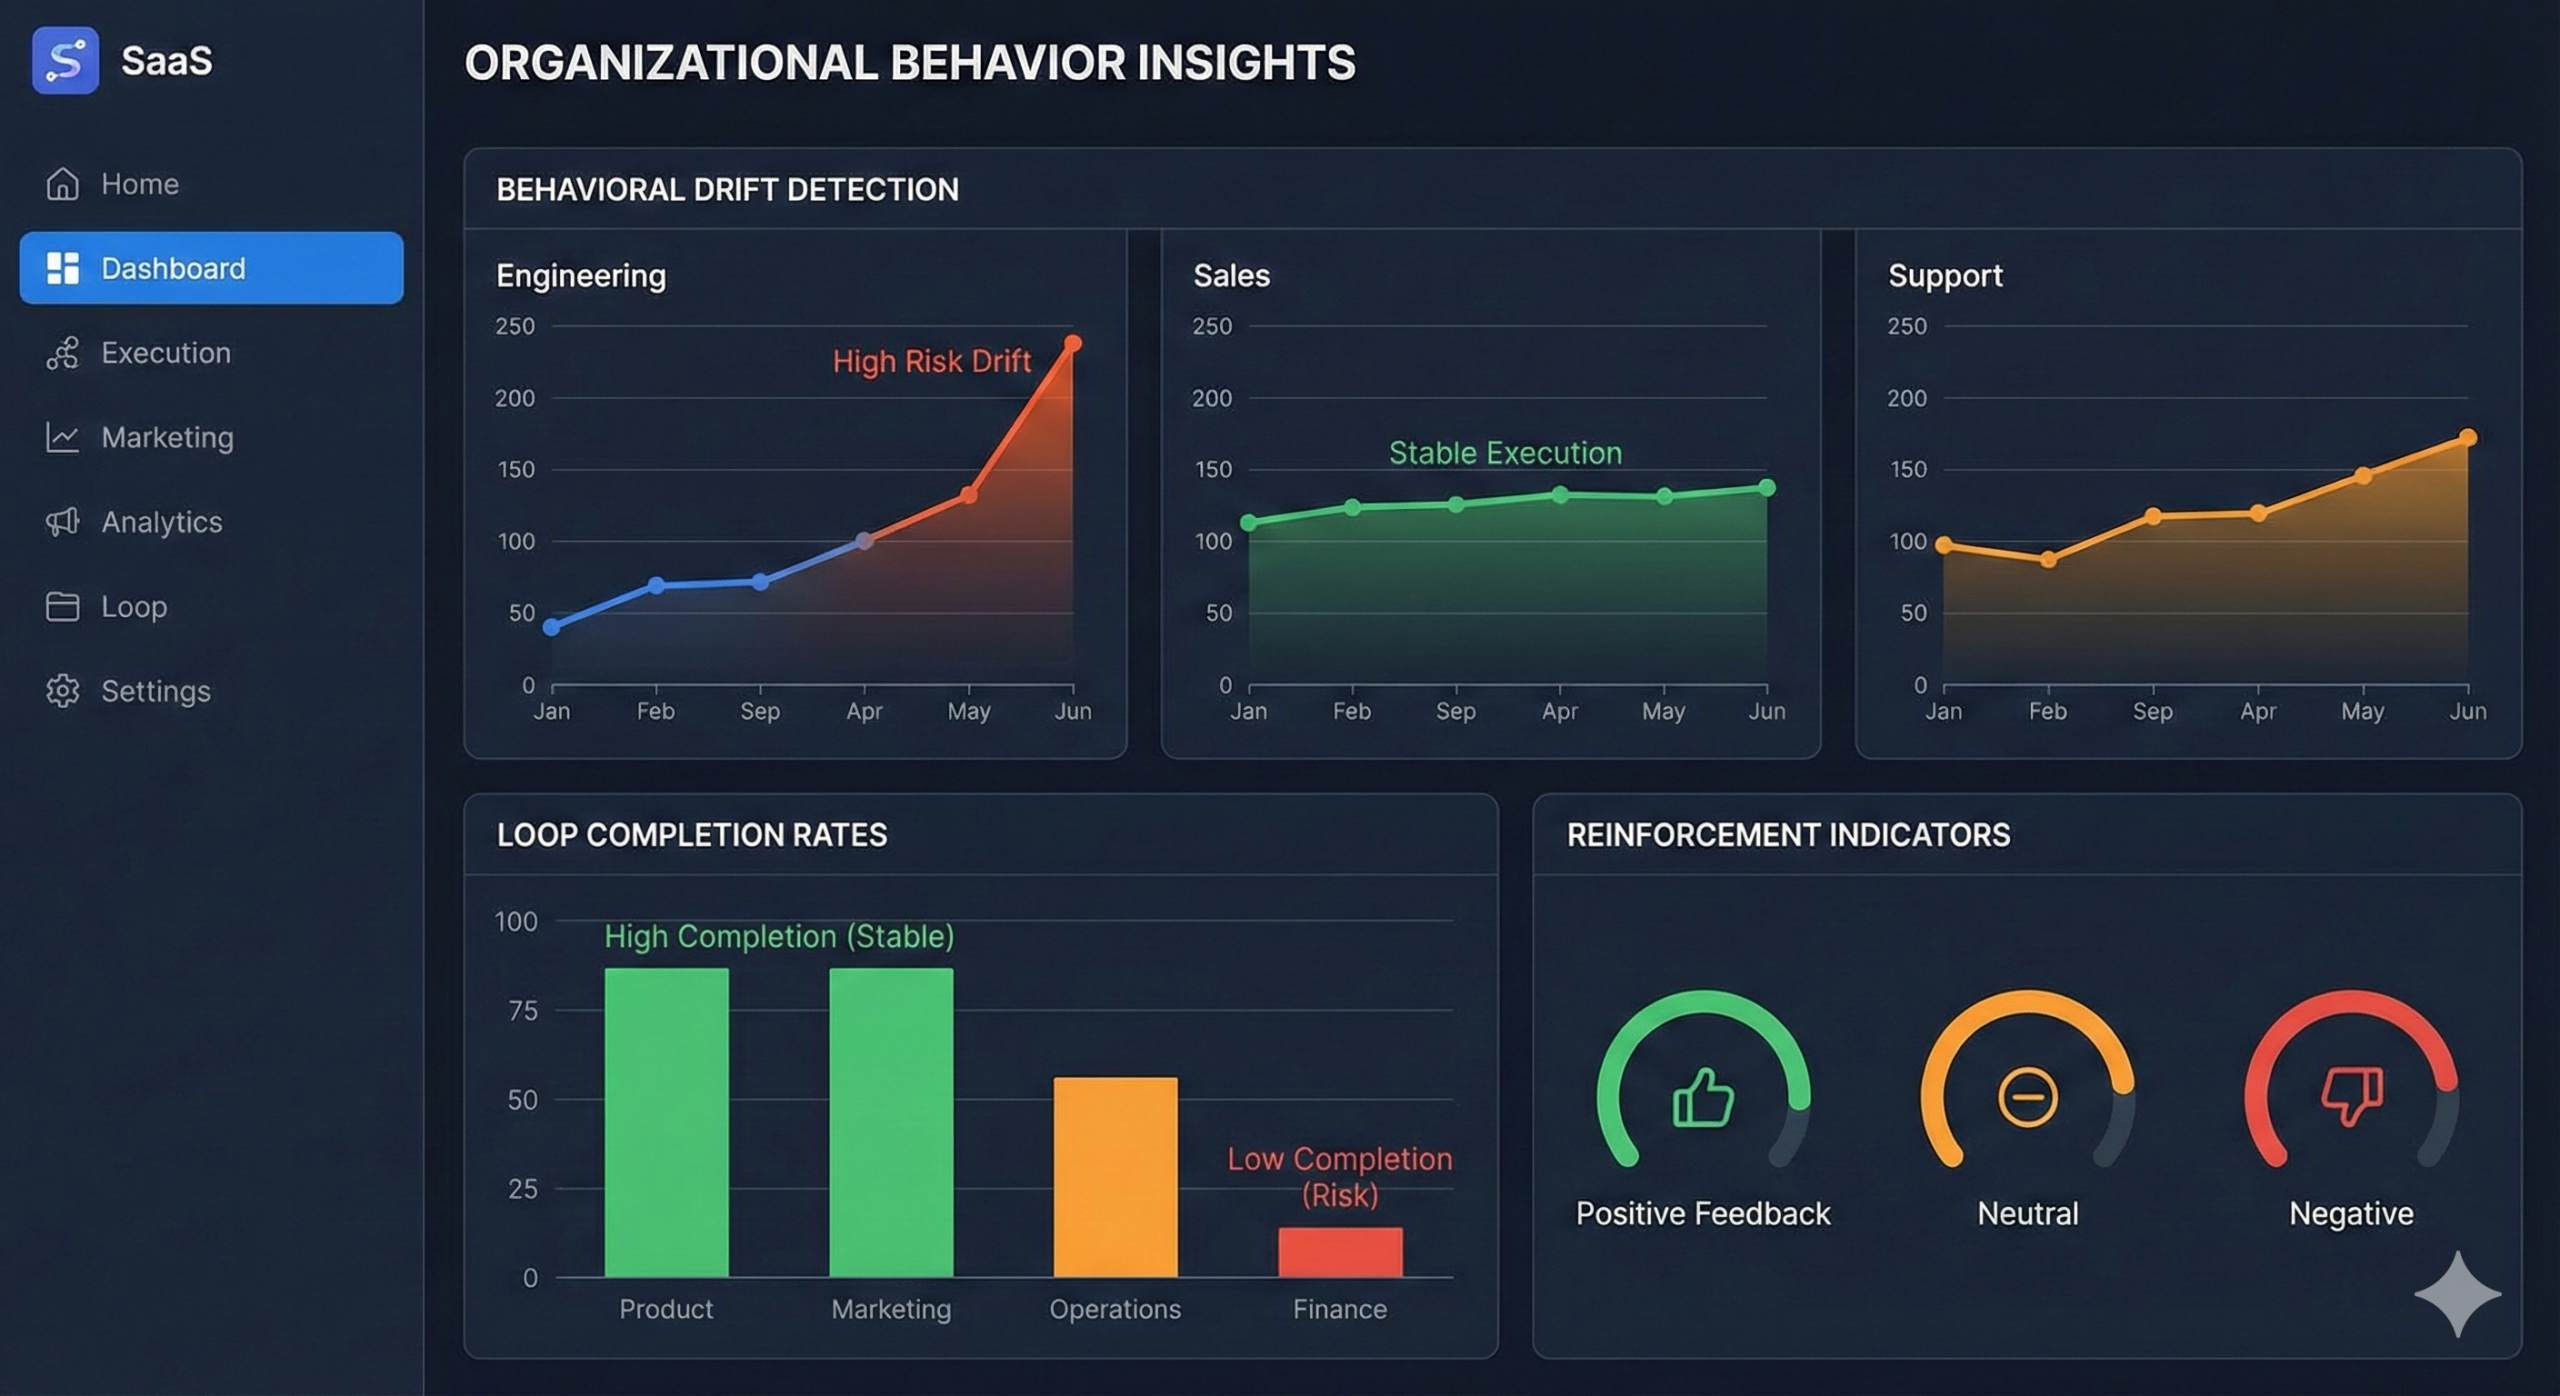
Signals warn. Patterns explain. A single delay means little. A repeated delay across teams is a governance issue. Behavior patterns show leaders where execution is structurally unstable, where drift is becoming normalized, and where reinforcement systems are failing.
Pattern Example: Partial Completion Drift
Execution begins strongly but rarely finishes. Leaders observe growing backlogs, frequent escalations, rising rework, and longer cycle times. This is not a motivation problem. It is organizational behavior decay at the execution level.
Pattern Example: Reinforcement Gaps
Leaders assume reinforcement is happening automatically. Behavior data reveals reinforcement loops missed most of the time, reminders arriving too late to matter, and coaching triggered inconsistently or not at all. Patterns make drift visible without blaming individuals. They show leaders where the execution system is breaking down. Comparing how engagement analytics differs from behavior measurement clarifies why patterns matter more than sentiment.
5. Proof: What Behavior Change Actually Looks Like
Proof is what separates belief from evidence. Not “we think behavior changed,” but “here is the data showing stable execution at scale.” Proof emerges when signals and patterns stabilize over time.
Proof looks like critical behaviors occurring reliably across teams, fewer drift events over time, reinforcement loops firing consistently, and faster recovery when disruption occurs.
Proof is not positive survey sentiment, training completion rates, manager anecdotes, or engagement scores. Those may describe perception. They do not prove organizational behavior reliability.
6. A Leadership Framework for Measuring Behavior in Execution
Organizations often jump straight to dashboards. Leaders need a governance sequence instead.
Step 1: Identify execution-critical behaviors that actually move decisions forward.
Step 2: Identify where drift typically occurs. Where does execution weaken after attention fades?
Step 3: Define signal points. Cue, action, completion, and reinforcement signals tied to execution, not individuals.
Step 4: Track patterns, not one-off events. Leaders govern trends, not anecdotes.
Step 5: Decide reinforcement strategy. What should be reinforced automatically, manually, or escalated? The science behind habit formation explains why structured reinforcement outperforms willpower.
Step 6: Govern through visibility. Dashboards should show drift risk zones, reinforcement health, and execution loop stability. Leadership discipline matters more than technology.
7. Why Measurement Without Reinforcement Fails
A common failure mode: dashboards are built, dashboards are reviewed, nothing changes. Measurement without reinforcement is analytics theater.
Leaders must use organizational behavior data to decide what to reinforce, where to intervene, and what to stabilize first. This is the shift from reporting to execution governance.
When measurement and reinforcement work together, execution becomes predictable without surveillance. Measurement creates visibility. Reinforcement creates stability. Without reinforcement, dashboards only explain failure after it occurs.
8. Key Takeaways
Behavior is execution, not psychology. Signals warn early. Patterns reveal systemic risk. Proof is stable, repeatable follow-through. Measurement must enable governance, not HR reporting. Reinforcement is what converts visibility into execution stability.
When organizations adopt this discipline, organizational behavior stops being abstract. It becomes visible, measurable, and governable.
What Teams Are Saying
“We’ve increased proactive feedback and communication in our organisation by 43% in the last 6 months. It’s categorically changed our business.”
“GWork made it possible for our company to navigate these unprecedented times. The deeply insightful platform made it easy to manage productivity, maintain high employee engagement, and develop a culture of ongoing constructive conversations.”
“Gwork has allowed us to keep our Growth culture strong as our team grows. It’s one of the main tools I would recommend to someone looking to increase their team’s performance.”
“GWork has been key to helping our people thrive in this new remote world of work. I recommend Gwork to anyone looking for a tool that covers not only hard performance numbers, but also the softer elements driving the people who make our businesses work.”
Frequently Asked Questions (FAQs)
1. What Signals Show Execution Drift?
Early warnings include skipped steps, delayed actions, unfinished loops, and reinforcement gaps that repeat over time. These appear inside workflows long before performance metrics move.
2. How Do Companies Detect Execution Drift Early?
By tracking behavior signals inside workflows, rather than waiting for performance metrics to fall. This means monitoring cue activation, action completion, and reinforcement consistency daily.
3. How Do You Identify Behaviour Patterns in Workflow Data?
Look for recurring friction across teams: repeated delays, incomplete loops, missed reinforcement, and compensating workarounds. Patterns reveal where the system fails, not people.
4. How Do Leaders Track Follow-Through Instead of Intent?
They measure execution behavior directly, what gets done, when, and how consistently, instead of relying on self-reported intent. Organizational behavior data shows whether decisions are translating into stable action.
5. How Do You Validate Behavior Change With Data?
Use trend lines showing greater consistency, fewer drift events, and stable reinforcement across critical behaviors. Real proof of organizational behavior change is not a survey result. It is reliable execution at scale.

